Improving Construction Task Efficiency
Project Goal
This project uses real-world construction task data to investigate why tasks get delayed and what can be done to improve timelines, safety, and team coordination. I developed this end-to-end data analysis as a portfolio project to demonstrate my skills in data engineering, visualization, and predictive modeling.


Data Used
Source: Kaggle (contributed by BIM Manager Jason Rymer)
Size: 12,000+ tasks from construction project apps
Two Files:
Forms: On-site checklists and quality/safety forms
Tasks: Actions triggered by those forms (e.g., fix, inspect)
Key Variables: task_group, type, created, status_changed, overdue, cause, priority, duration_days
Step 1: ETL (Extract, Transform, Load)
Standardized column names for consistency
Handled missing data:
Removed high-missing-value columns (like target, association)
Filled in unknown priority, cause, and task_group
Dropped rows missing essential information
Generated a duration_days variable to measure how long a task took
Step 2: Exploratory Data Analysis
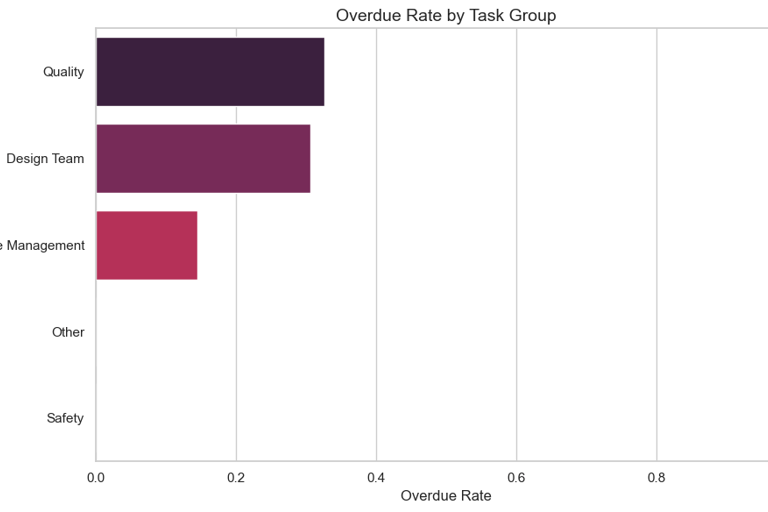
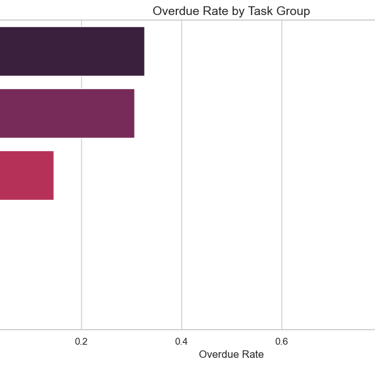
Graph 1: Overdue Rate by Task Group
Highest overdue rates were in the Quality group, followed by the Design Team
Site management and safety had relatively low delay rates
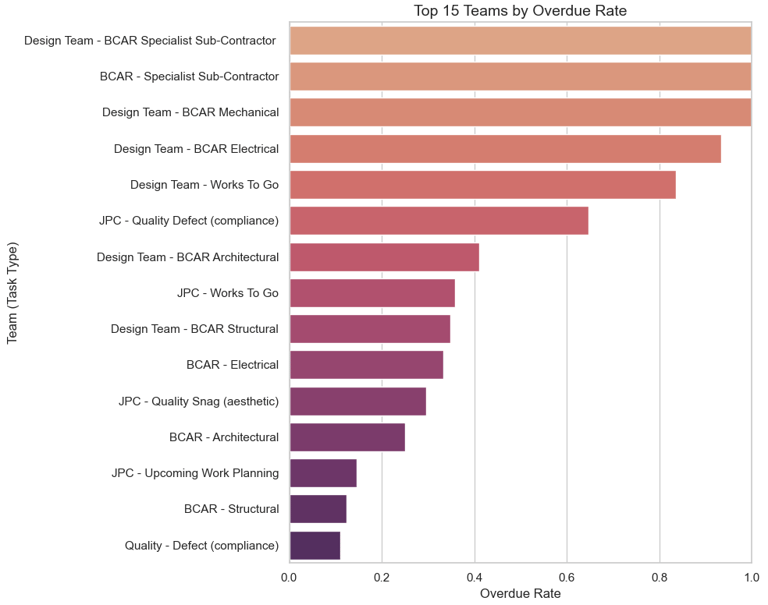
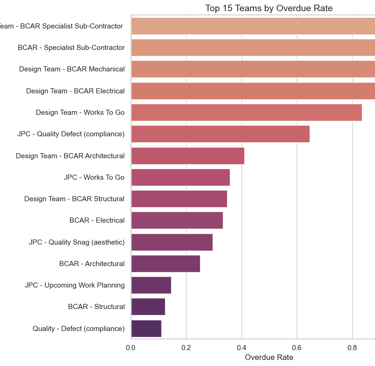
Graph 2: Overdue Rate by Task Type
Many of the top 15 delayed task types belonged to the Design Team
Especially BCAR-related types like Design Team - BCAR Electrical
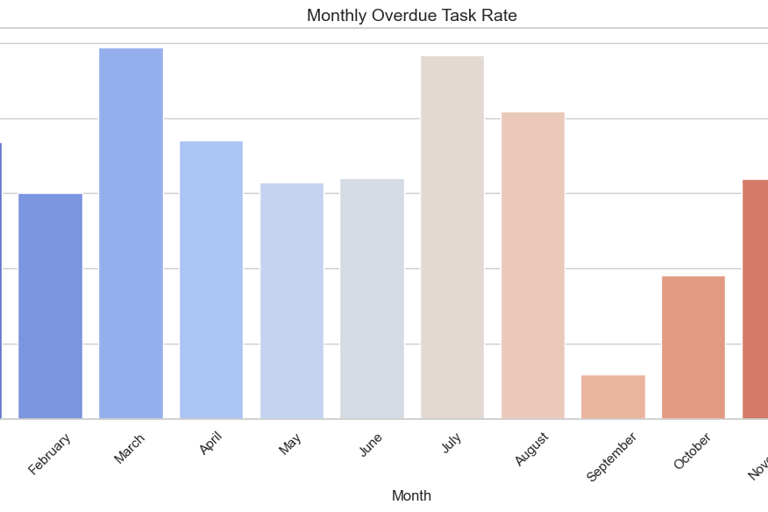
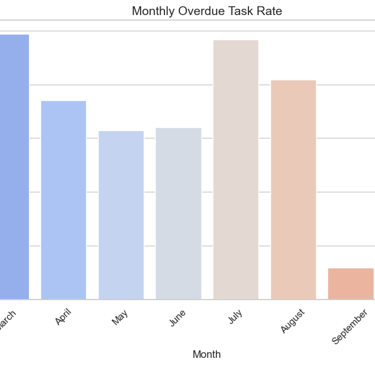
Graph 3: Monthly Overdue Trend
Overdue tasks peaked in March, July, and August
September and October showed recovery and fewer delays
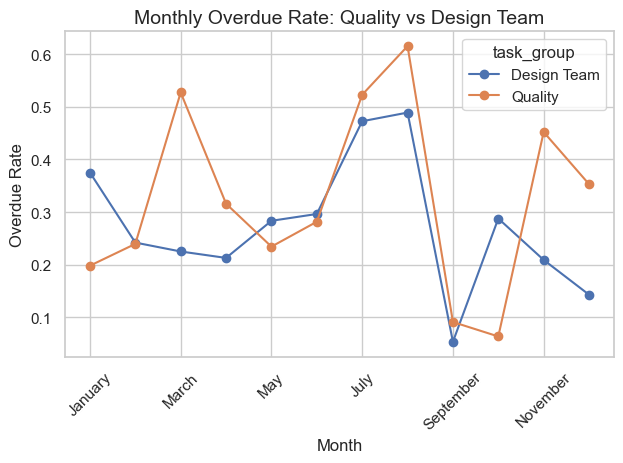
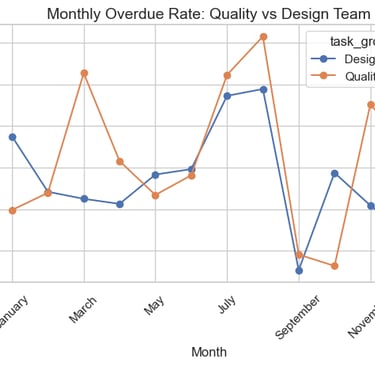
Graph 4: Overdue by Task Group Over Time
Quality Team: Recurring delays every ~3 months, possibly tied to phase-end inspections
Design Team: Clear spike in July/August, likely due to vacations or design deadlines
Graph 1
Graph 2
Graph 4
Graph 3
Step 3: Root Cause Analysis
To go deeper, I created filtered datasets for the Design Team and Quality Team and modeled overdue (yes/no) using:
Features: priority, cause, duration_days
Models: Logistic Regression (baseline) and Random Forest (for interpretability)
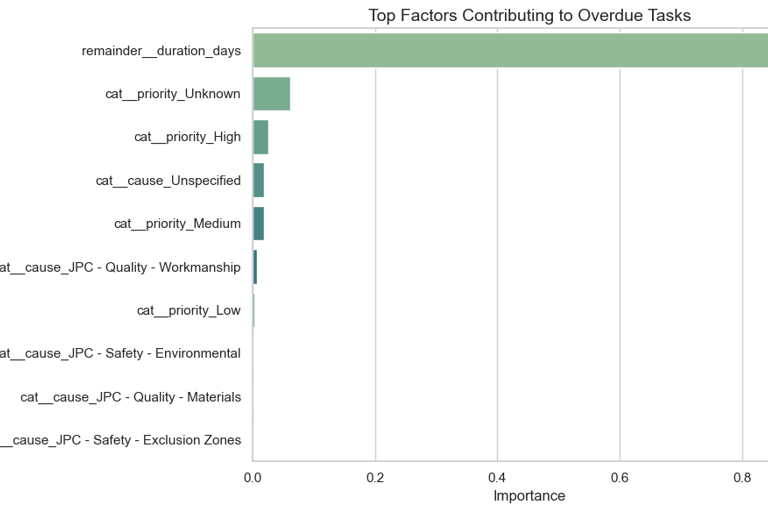
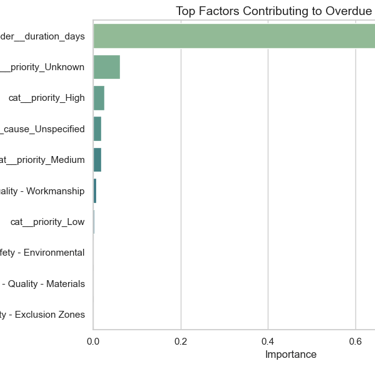
Design Team Modeling Results
Accuracy: 81% using Random Forest
Top Drivers of Delay:
Long task durations (especially July-August)
Unknown or unspecified priority and cause
Interpretation: Design tasks get delayed when they are time-consuming and poorly described or tagged, suggesting need for better documentation and summer resource planning.
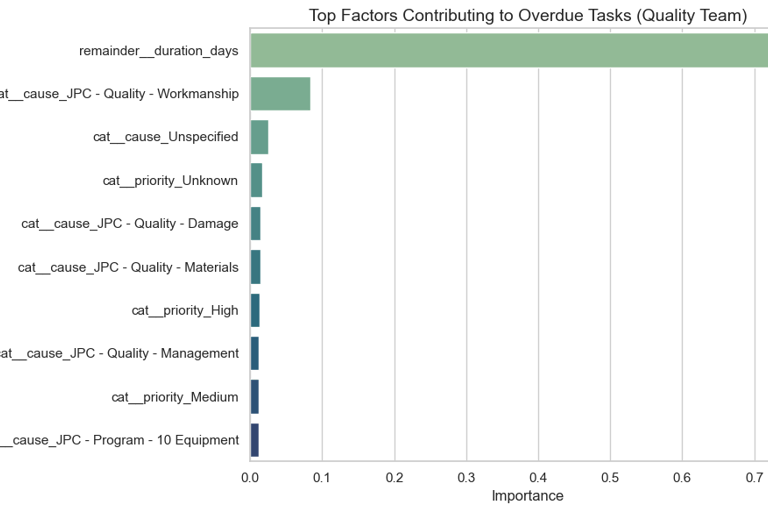
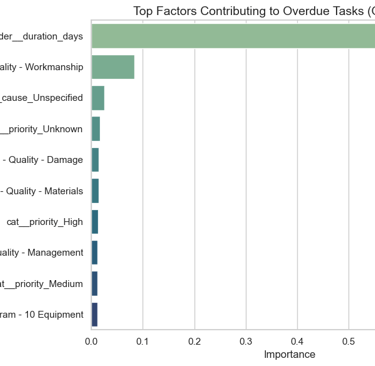
Quality Team Modeling Results
Accuracy: 87%
Top Features:
cause=Workmanship issue
Long task durations
Unclear or unspecified task metadata
Interpretation: Quality delays stem from recurring field problems and re-inspections. Better task tracking and urgency tagging could reduce repeated delays.
Design team
Quality Team
Final Insights & Recommendations
1. Improve Documentation
Many delayed tasks lacked clear priority or cause
Mandatory structured inputs in field apps can reduce ambiguity
2. Plan for Cyclical Risk
Quality team shows periodic delay spikes. Consider adjusting inspection timelines or adding short-term help.
3. Summer Staffing for Design
Design delays peak in summer. More pre-summer planning or contract buffers could reduce pressure.